Climate History Card: Monitor temperatures, setpoints and HVAC activity on Home Assistant
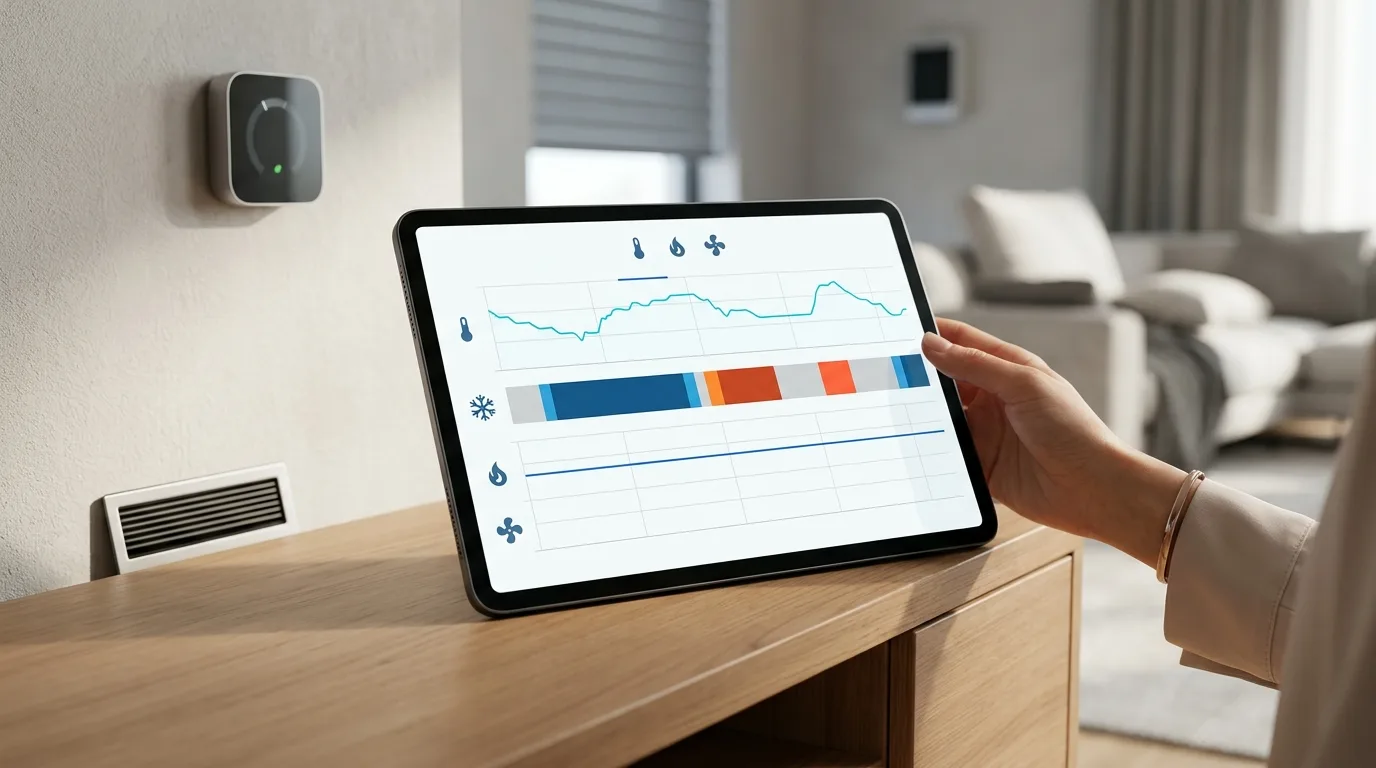
The new Climate History Card for Home Assistant allows you to view temperatures, setpoints and HVAC activity on a single timeline. You discover
Climate History Card Home Assistant is at the center of the news: In the world of home automation, having precise control and a clear vision of the functioning of your air conditioning system is essential. For Home Assistant users, a new resource promises to make this task easier: theClimate History Card. This dashboard card was designed to offer an immediate comparison between the actual recorded temperature, the set point set and the activity of the HVAC equipment, all on a single intuitive timeline. The goal is to provide users with a powerful tool to analyze and optimize home comfort and energy efficiency.
News for home climate control
The Climate History Card represents a significant evolution in how Home Assistant users can monitor their climate control systems. Its ability to overlay complex data in an easily interpretable format makes it an invaluable tool for anyone wanting to delve deeper into how their heating or cooling works.
What is the Climate History Card?
The Climate History Card is a customized dashboard card for Home Assistant that allows you to comparatively view measured temperatures, set points and the activity of HVAC (Heating, Ventilation, and Air Conditioning) devices. Unlike standard displays, this card presents the measured temperature as a continuous line, while the setpoints are shown as steps, clearly highlighting the desired variations. You can add multiple zone monitoring, including outdoor temperature and a variety of secondary data such as humidity. Furthermore, the card can shade the periods in which the HVAC equipment was active, offering a complete view of the climate trend and energy consumption related to air conditioning.
Main features of the Climate History Card
Comparative display of temperatures and set points
The main strength of the Climate History Card lies in its ability to directly compare the actual temperature of the environment with the desired one (setpoint). The graphical representation clearly distinguishes between these two values, allowing you to quickly identify deviations and understand how the system is reacting to the settings.
Monitoring of HVAC activity
The card allows you to view when the HVAC equipment has come into operation. This information, represented graphically, is crucial for evaluating the efficiency of the system and for correlating the system's activity with temperature variations or with specific commands given.
Integration with Home Assistant date selector
The Climate History Card integrates seamlessly with Home Assistant's date picker, allowing users to easily navigate between calendar days to analyze historical temperatures and HVAC activity. Alternatively, it can show a sliding time frame.
Installation of the Climate History Card
Installation of the Climate History Card is managed via HACS (Home Assistant Community Store). Users can add it as a custom repository for dashboards by entering the project's GitHub repository URL. After installation, simply refresh your browser to make the card available. Inclusion in the default catalog is pending, but installation via custom repository is already active.
Installation via HACS
To install Climate History Card:
- Open HACS in Home Assistant.
- Enter the sectionFrontend.
- Open the menu with the three dots at the top right and selectCustom repositories.
- Enter this address:
https://github.com/shogun301/climate-history-card- SelectDashboardsas category and add the repository.
- NearClimate History Cardin HACS and awardsDownload.
- Once the installation is complete, refresh your browser completely using
Ctrl+F5on Windows orCmd+Shift+Ron macOS.
Inclusion in the default HACS catalog is still pending, so currently you need to add your custom repository or use the direct linkOpen in HACSprovided by the developer.
Basic configuration
Climate History Card Home Assistant - A minimal example configuration for the Climate History Card, using dummy entities, shows how to define zones and their entities for temperature, setpoint and HVAC activity status:
type: custom:climate-history-card
title: Climate history
zones:
  - name: Office
    temperature: sensor.office_temperature
    setpoint: sensor.office_setpoint
    active: binary_sensor.office_hvac_active
It is essential to replace dummy entities (such assensor.office_temperature) with the real ones of your Home Assistant system. The temperature unit configured on the card will control the labels displayed, but the temperature sources must use consistent units. The project is released under the Apache 2.0 license and user feedback on configuration and readability with different thermostat setups is greatly appreciated for futureimprovements.
Verdict
The Climate History Card for Home Assistant proves to be an extremely useful tool for anyone who wants a detailed and visually clear analysis of their climate control system. Its ability to correlate temperature, setpoints and HVAC activity on a single timeline makes it ideal for optimizing comfort and energy efficiency in your home.
Source:Community Home Assistant


Commenti
Ancora nessun commento. Sii il primo a partecipare.